


 The CC Certificate program helps Creative Commons build professionals’ capacity in open licensing and open practices. The program offers global courses for academic librarians, educators, and cultural heritage advocates; but courses are open to everyone. Through global discussions, course participants work through what it means to engage in an online commons of shared knowledge and culture.
The CC Certificate program is an investment in the global community of open creators and advocates. It is a tool to support people as proactive participants in our shared digital commons, and strengthen the diversity of creative thought and expression to improve open access to open knowledge and culture.
But how can we understand the potential impact of this effort on our global community? We explore the CC Certificate programs’ effects on community members through a series of focused measures, such as interviews with alumni who developed a master level courses related to open education, open policies, or openly published a digital collection of artwork, with cultural considerations. We also draw feedback from surveys and workshops.
In this post, we highlight one evaluation effort analyzing how Certificate course participants’ knowledge changes over the 10 weeks of engagement. We administer baseline and endline surveys to participants on a voluntary basis, in order to: (1) understand if participants develop a greater understanding of our course content, and (2) understand differences between course communities, where participants have more challenges in course content, and what this data might mean for our teaching practices.
CC works with Jonathan Poritz to track participants’ understanding of course content, and how it changes over time. Learn more about the baseline and endline survey background, methodology and findings in a detailed analysis on Jonathan Poritz’s website. [1]
Below are the top four takeaways from an evaluation of our baseline and endline surveys on copyright, open licensing, and reuse of CC-licensed content supported by our experience facilitating the course.
Top takeaways:
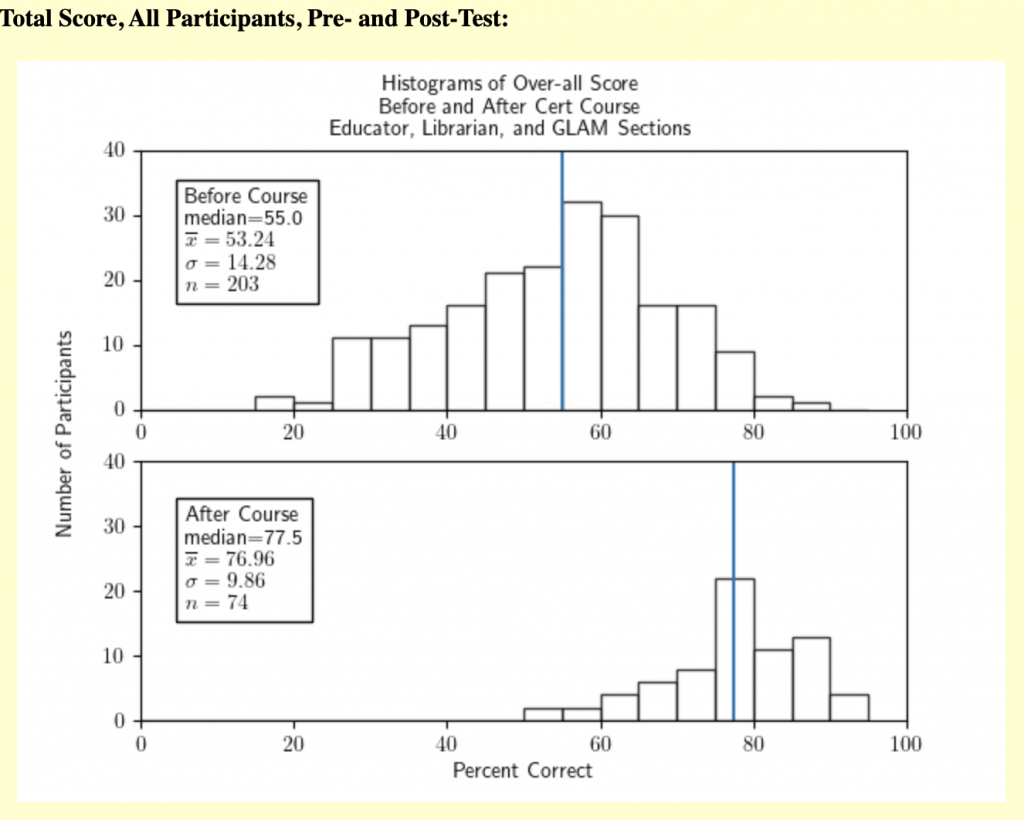
- While our open culture course (the GLAM Certificate) has not been running long enough to gather meaningful data, we do find participants in the Educators and Academic Librarians courses make significant gains from taking their respective courses. We have statistically significant evidence that the post-test scores are more than 21.2% higher than the pre-test scores, at the 5% significance level. Both the Educator and Academic Librarian participants had fairly similar starting scores, ending scores, and (therefore) gains from taking the course as each other (and the whole group).
 [2]
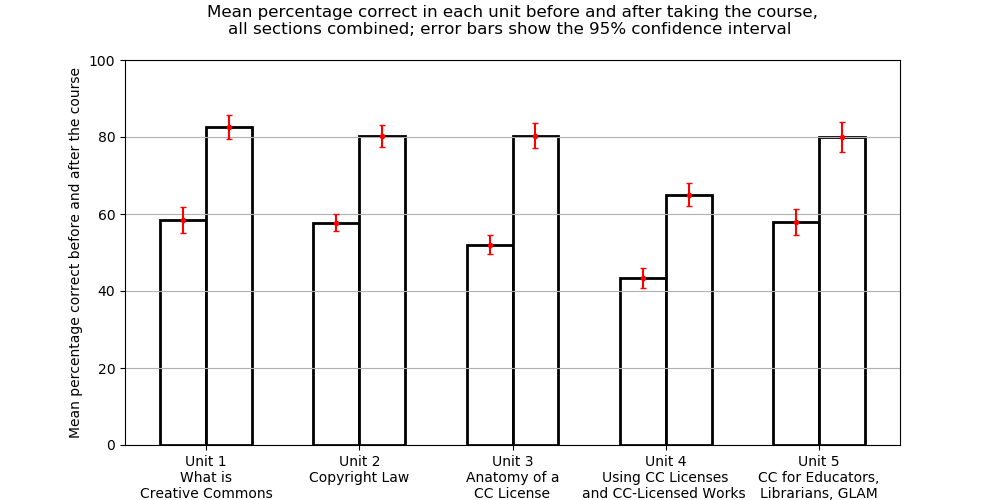
[2] - The surveys confirm our experience that Unit 4, which covers reuse of CC licensed content, is the most challenging unit for participants. Most graduates score between 80 – 85 points on all units, except Unit 4, where they score around 65 points. What does this mean? We should spend more time and focus facilitating this unit for participants.
 [3]
[3] - On a side note: almost everyone realized they could not provide legal advice following the course. This will make course facilitators chuckle, because we make it a habit to remind participants that we cannot provide legal advice–that’s something shared between lawyers and the clients hiring them.
- While this analysis sincerely charms us, we need to contextualize it. These data points show increased knowledge over time, which is arguably the first building block in empowering our communities with the tools they need to take advantage of the “copyright meets digital” landscape. What participants then do with their increased knowledge is crucial.
Ideally, evaluation of Creative Commons training efforts will also feed into a broader conversation about how we can evaluate, learn and adapt in open education training efforts more broadly. Now we see a wonderful variety of professional development opportunities in this field. We expect each of our efforts to be like puzzle pieces, contributing to the larger impact of open education. Ideally, we can track how the CC Certificate can work with other efforts to best support the agency and learning of our global community members.
We want to thank all of the anonymous CC Certificate participants who volunteered their time to help us with this analysis.
[1] – Of note: Because the surveys were voluntary, we were concerned about the risk of volunteer sample bias. To rule out one element of this bias, which would show favorable endline survey results in favor of people who were “good students” or on the trajectory to graduate anyway, Jonathan analyzed just the results of participants who passed the course. We did this to address the potential critique: “maybe the course doesn’t teach anything, but merely convinces the bad students not to take the post-test, so the distribution of post-test scores of course looks better than the distribution of pre-test scores.” We learned that by making a pair of histograms for over-all score before and after the course from only participants who were successful in the course, then they should look pretty much the same.
[2] – Per Jonathan Poritz, if you’re a little rusty in your statistical terminology, most of the graphs in the full analysis are histograms, meaning that the heights of the bars indicate how many scores lie in the range of percentages covered by the base of that bar on the horizontal, “Percent Correct,” axis. For example, the bar in the “Before Course” histogram whose left edge is at location 60 on the horizontal axis has a base going from 60 to 65 on that horizontal axis and height of 13. That means that 13 participants’ pre-test scores were in the range 60 to 65% correct.
The vertical blue line in these histograms is located at the median of the scores for that graph, meaning that half of the scores in that dataset are less than (to the left of) that score, and half are greater than (to the right of) that score: it is a good measure of the “middle value” of the dataset.
The x̄ in the key box in each graph indicates the mean (or average) of that dataset, which is another measure of the middle of data, but means are more sensitive than medians to outliers, meaning that atypical scores way off to one end will pull the mean in that direction but not the median.
The σ in the box is the standard deviation of that dataset, which is a measure of how much variation there is in the data.
The η in the box tells the size of that dataset.
[3] – The term “95% confidence interval” is a standard assumption in applied statistics. The 95% confidence interval is a range of values within which we would expect to see 95% of those sample means if we were to (1) repeatedly collect random samples and (2) recalculate the sample mean each time. If the subset of participants who took the test were a random sample of course participants (rather than a self-selected group of volunteers), then the sample mean would slightly vary every time a new random sample was chosen from among all participants.
Posted 22 June 2022